Testing of Childhood Blood Lead Levels in Allegheny County
|
Allegheny County Children (< 6 years) Tested for Blood Lead with Venous Confirmations
|
|
Year
|
Children tested (< 6 yrs)
|
3.5+ ug/dL Confirmed
|
5+ µg/dL Confirmed
|
10+ µg/dL Confirmed
|
|
2017
|
17080
|
*
|
457
|
2.67%
|
116
|
0.68%
|
|
2018
|
23737
|
481
|
2.03%
|
144
|
0.61%
|
|
2019
|
23949
|
435
|
1.82%
|
131
|
0.55%
|
|
2020
|
20913
|
341
|
1.63%
|
95
|
0.45%
|
|
2021
|
20238
|
543
|
2.68%
|
387
|
1.91%
|
126
|
0.62%
|
|
2022
|
19881
|
624
|
3.14%
|
378
|
1.90%
|
110
|
0.55%
|
|
2023
|
23237
|
724
|
3.12%
|
452
|
1.95%
|
113
|
0.49%
|
*Before 2021, the threshold for elevated blood lead levels was 5 µg/dL

Allegheny County’s universal lead testing policy has led to approximately 5,000 more children being tested each year. In 2021, the Allegheny County Health Department lowered the threshold for elevated blood lead levels (EBLL) from 5 µg/dL to 3.5, allowing earlier intervention and monitoring for about 200 children annually. Between the implementation of universal testing in 2018 and the lowered threshold in 2021, the percent of children tested with an elevated blood lead level (5+ µg/dL) decreased steadily. Since that time, the percent has remained fairly consistent for those with levels above 5 µg/dL, but the percent of children with EBLL above 10 µg/dL continues to decrease. Currently, about 3.1% of children tested have an elevated blood lead level (3.5 µg/dL).

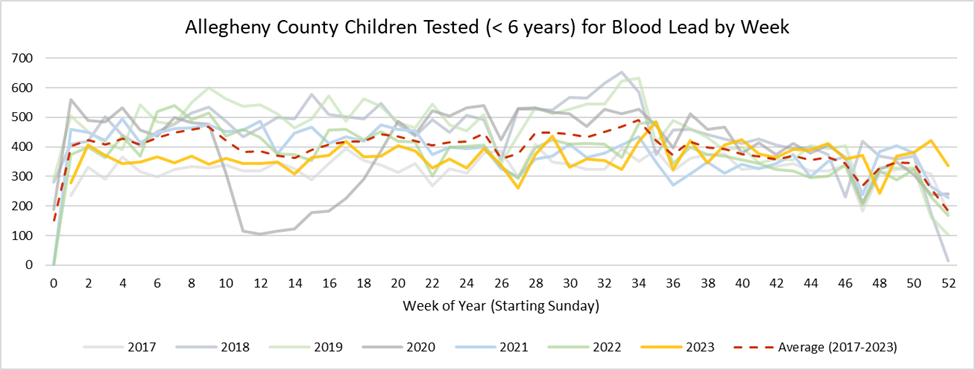
Monitoring testing by week allows ACHD to identify seasonal trends and any possible irregularities in reporting to the system. The most prominent trends observed are the increase in testing numbers leading up to the start of the school year (weeks 28-35) and the decrease in testing around holidays. In 2020, typical trends were not observed due to the COVID-19 pandemic, where the number of children tested decreased significantly starting at weeks 9 and 10 (March 2020). However, despite subsequent seasonal waves of COVID-19, 2020 trends were similar to 2019 for the remainder of the year. Since 2021, seasonal trends have remained relatively stable.

Monthly trends vary some from year to year, but August tends to be the month with the highest number of children tested.

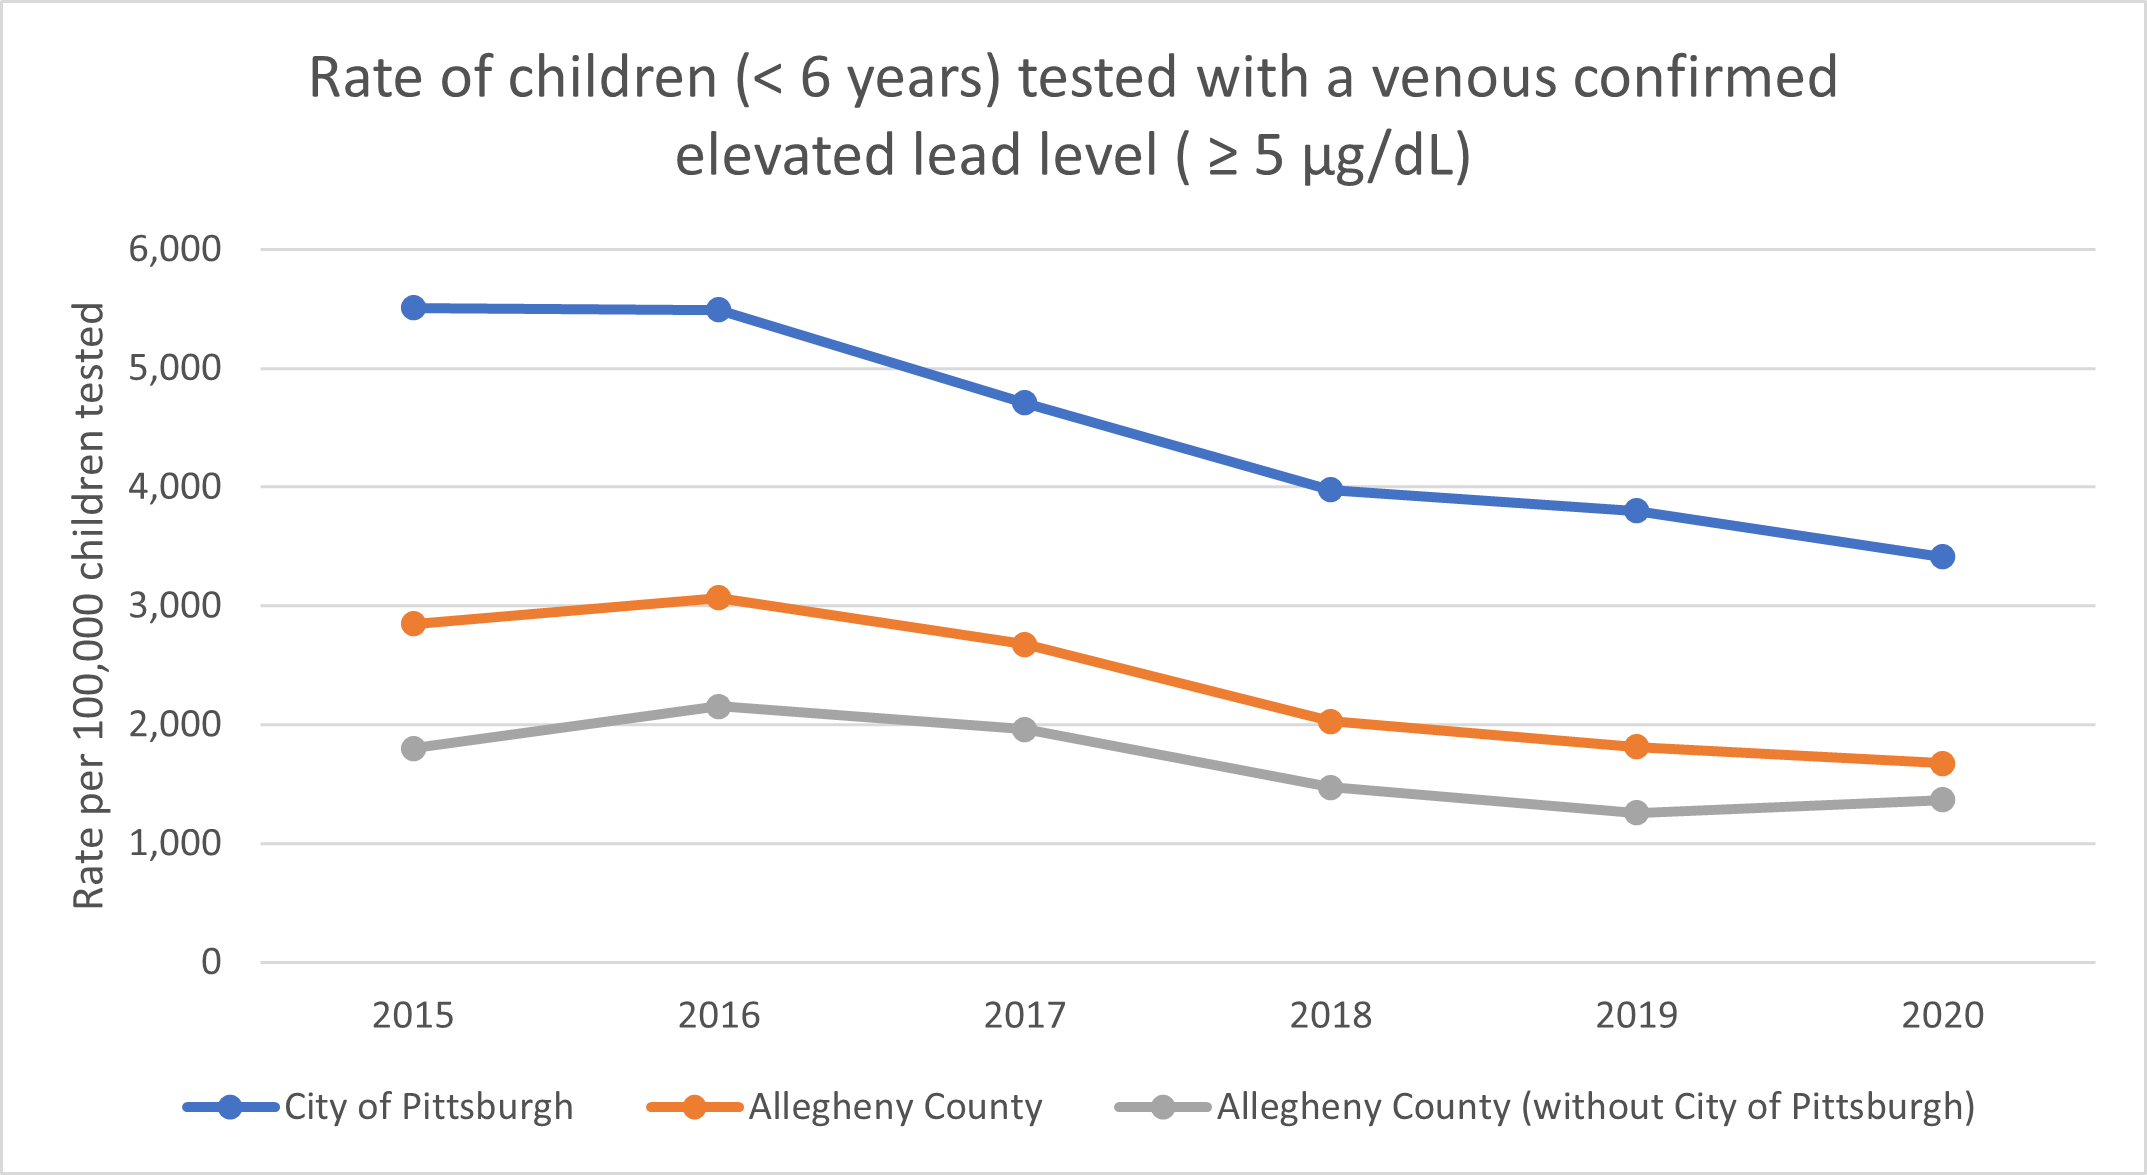
The City of Pittsburgh has consistently had a higher rate of children tested with a confirmed elevated result compared to the County as a whole. In 2020, 3,411 per 100,000 children (3.4%) tested who lived in the City of Pittsburgh had a confirmed elevated lead level compared to 1,675 per 100,000 (1.7%) of all Allegheny County children tested.
Exposure to lead through contaminated paint is a significant risk in Allegheny County and may explain some of this disparity. Lead paint was banned for consumer use in 1978, houses built prior to this are at an increased likelihood of containing lead-based paint. The older the home the higher the likelihood of containing lead-based paint. In the city of Pittsburgh an estimated 59.6% of housing units were built before 1950 compared to 39.1% of all county housing units. A higher percentage of homes built prior to the banning of lead paint can translate to an increased risk of exposure for children living in this area.
See Housing Built Before 1980 and Housing Built Before 1950 in the Maps and Testing Data section.

Allegheny County’s universal testing policy requires a child’s first test to be completed between 9-12 months of age. According to Pennsylvania’s age range requirements for screening visits, 412 days is the maximum age to complete the 1 year screening visit. The percent of Allegheny County children who received testing for lead by the age of 412 days has increased since 2014. Of all Allegheny County children tested in 2023, 37.9% were under the age of 1.